
So you’ve been hearing—from your nerdy data science colleagues, from that class you took way back when, from Googling around, from (maybe most importantly) your boss—that it’s important to weight a survey study before analyzing it. Why exactly is that? And how do you do it?
This short guide will help you understand the benefits of weighting and get you started with weighting your own surveys using SurveyMonkey's brand tracker solution.
Why should you weight your survey?
Broadly, the goal when weighting a survey is to make the sample of respondents look more like the broader consumer population you’re interested in learning about.
For example, you might be running a brand tracker in order to understand how consumers across the entire United States think about your company’s brand and how that’s changing over time. Or maybe you’re running a consumer preferences survey in hopes of understanding your customers in a particular state or regional market.
So how can weighting actually improve your market research insights? Let’s walk through three scenarios, with a concrete case study for each, to give you a feel for what weighting can do.
Weighting creates the most representative, accurate profile of your target consumer, even if you launched a targeted survey
Example: You work for a sneaker company and have been tasked with running a market research study in order to assess brand equity in the US market. The goal is to accurately capture brand equity perceptions across the entire national customer base. You’ve opted to purchase targeted responses through SurveyMonkey that are representative of the US adult population on age and sex.
Problem: Even though you fielded a targeted US Gen Pop study, you check the dashboards and it looks like the sample still is a bit skewed towards older, college-educated men.
Moreover, it looks like other variables that you didn’t target for, specifically state and income, are quite skewed: respondents from California are way over-represented and so are high-income respondents.
The cost to re-run a study elsewhere to target for region and income balances would put you over budget and take too long.
Solution: You can take your existing survey and create weights for state and income based on the most recent numbers available from the US Census.
After re-weighting your survey based on answers to the corresponding questions “What state do you reside in?” and “What is your total household income?,” your survey is now highly representative of the US adult population on region, income, age, and sex and the trends you discover are accurate of the national market.
Weighting gets rid of misleading “bumps” and “valleys” over time in your brand tracker
Example: Your company’s marketing team has launched a new ad campaign tailored to consumers in the New York metro area. In your latest brand tracking study, you see a large uptick in favorability on your US national brand tracker.
Problem: You’re not sure whether the ad campaign had a national impact (like through word-of-mouth) or if this uptick only reflects an increase in favorability for people who directly saw the ad campaign in New York.
Solution: You create weights for respondents based on state and metro area that accurately reflect the true population composition of adults living in each state and metro area. This effectively down-weights over-represented respondents (e.g. those from big cities like New York City) in your brand tracker. Upon re-analyzing the data, you realize that your national brand equity over the time period of this new ad campaign has actually remained largely stable.
Weighting helps you gather insights across multiple target audiences using the same data
Example: The tech company you work for has launched a revolutionary laptop. You, a market researcher, ran a massive product perception survey on the entire US adult population, but the sales team also wants an accurate reading of brand perception for two customer segments:
(1) Incoming college students, which is a huge customer base for laptops.
(2) California consumers, the initial market that the new laptop will be rolled out.
Problem(s): You launched your survey on SurveyMonkey’s US Gen Pop panel, which is targeted nationally, rather than in California or just for college students. You would rather not spend the money it would take to run follow-up studies just in California or just targeted at college students.
You could subset your results to look at just respondents in California or those that answered that they are still in college. However, subsetting alone will demographically skew your sample in other ways, e.g. by gender, race, region.
Solution: You look up two things from the US Census. The first is the demographic composition (along age, sex, education, race) in California. The second is demographic composition (along sex, race, income, region) for incoming college students.
Using these two sets of population numbers, you create two sets of target weights for the relevant question in your survey (“What is your age?”) and re-weight your survey to capture a profile of both California respondents and college students. You can now accurately analyze trends for each segment.
How do you weight your survey?
Now you should have a clearer picture of why weighting surveys is important, what weighting can do for you, and what can go wrong if you don’t weight a survey. So how do you go about weighting a survey correctly?
Let’s go over how to weight a survey using SurveyMonkey’s built-in weighting feature using a real-life brand tracker survey launched and analyzed by the SurveyMonkey Research Insights Team.
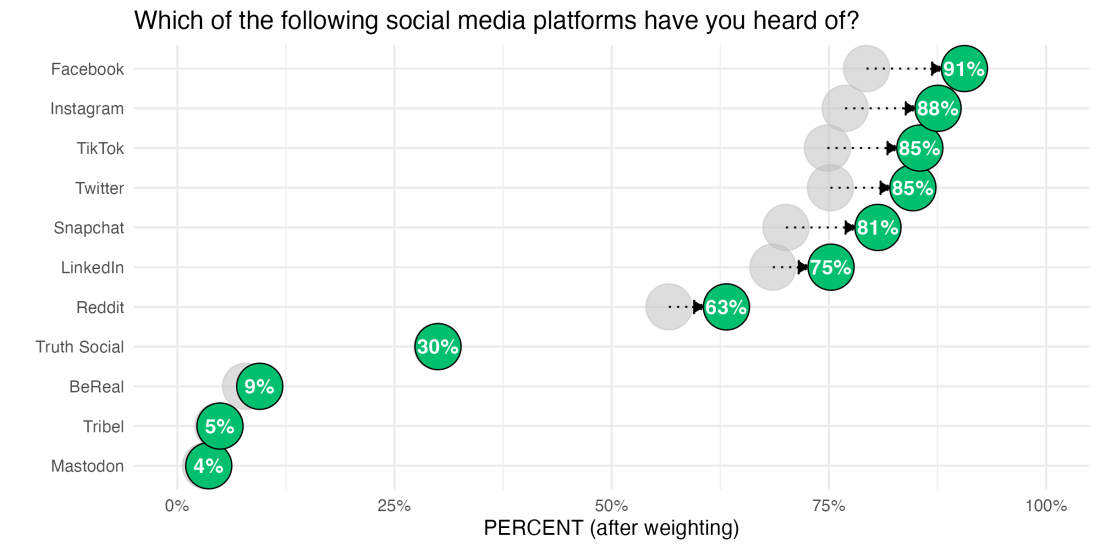
In this study, respondents are asked, among other things, their familiarity with and usage of different social media platforms. One of the key results in this study is the percentage of respondents who have heard of each social media platform, which we can see in the chart below.
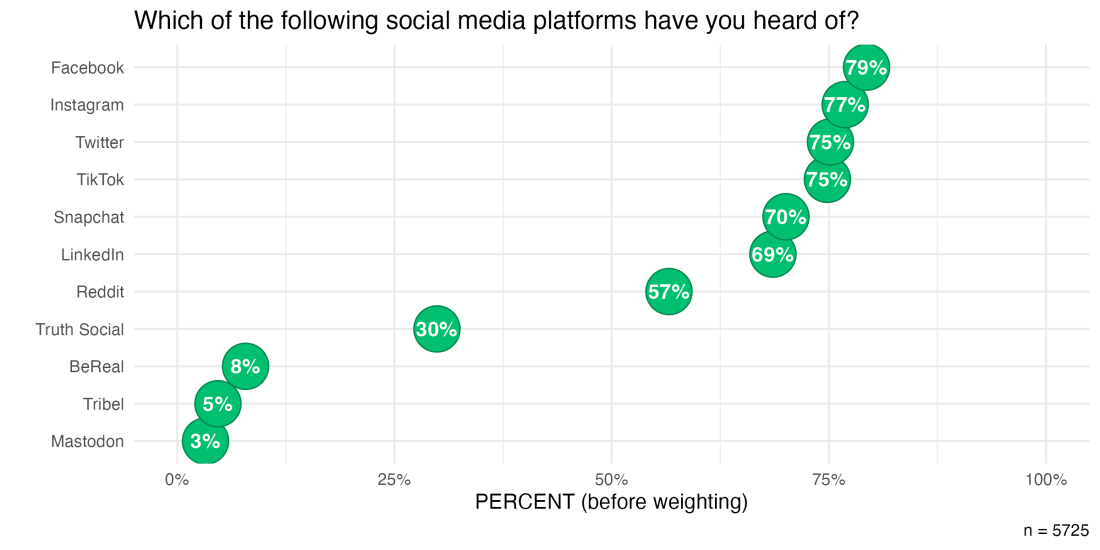
From initial impressions, it seems unusual that the most popular social media platform—Facebook—only had, at most, a 79% familiarity rate. That’s nearly the percentage of adults in the US that have a Facebook account. Surely, many more Americans have at least heard of Facebook even if they don’t have an account?
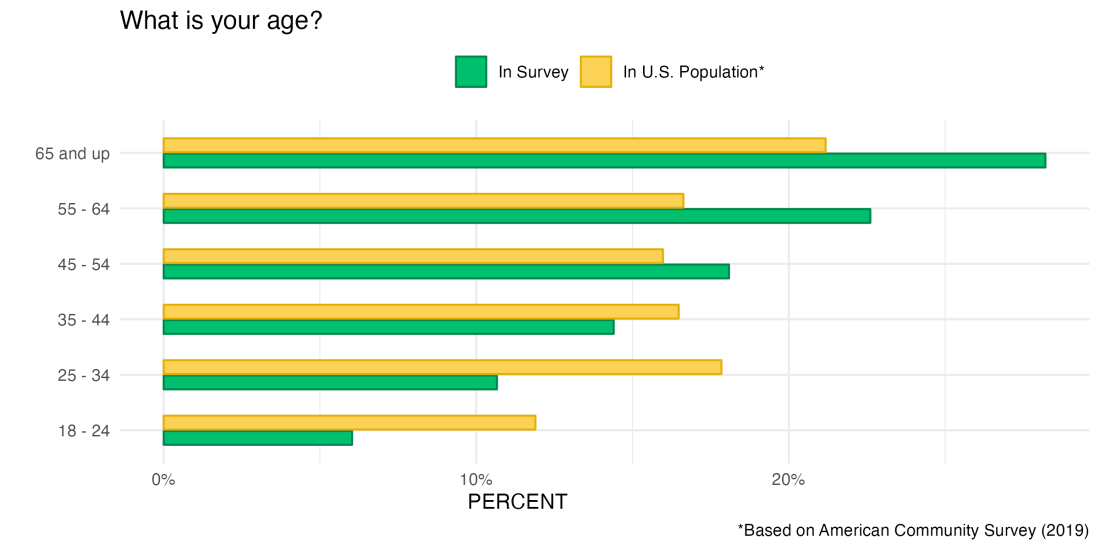
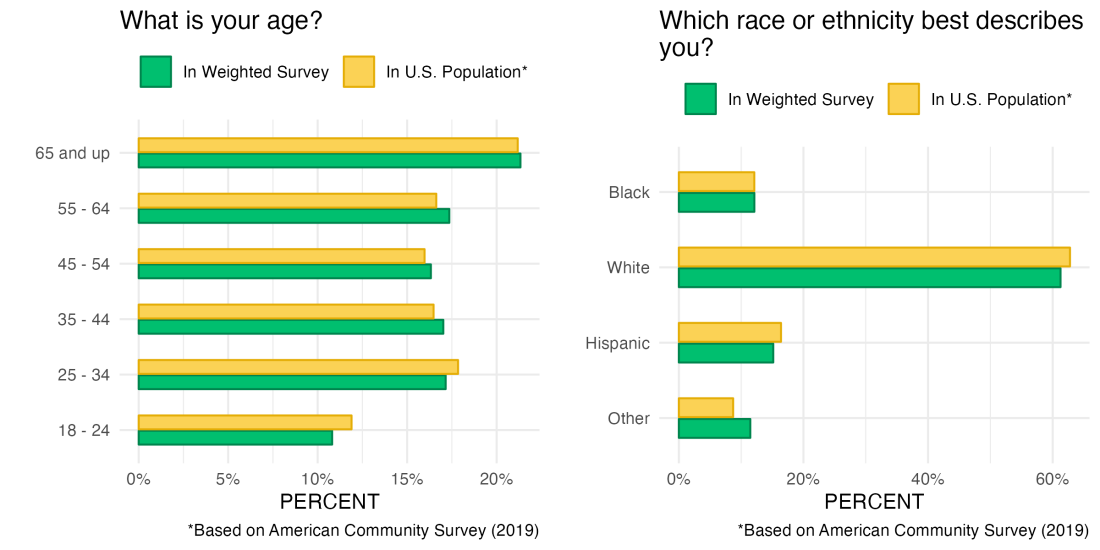
Digging a little bit deeper into the demographic composition of our sample, we can see one potential issue: our sample skews on the older side. Below is a comparison of our respondents’ age breakdown (in green) with the broader US population (in yellow). It’s clear that our sample is not representative of the US consumer population as a whole: the median age in our sample is 54, while the median age in the US is closer to 38!
Now that we’ve diagnosed one issue (of possibly many!) with representativeness in our survey, let’s walk through how to fix this.
1) Choose your weighting variables
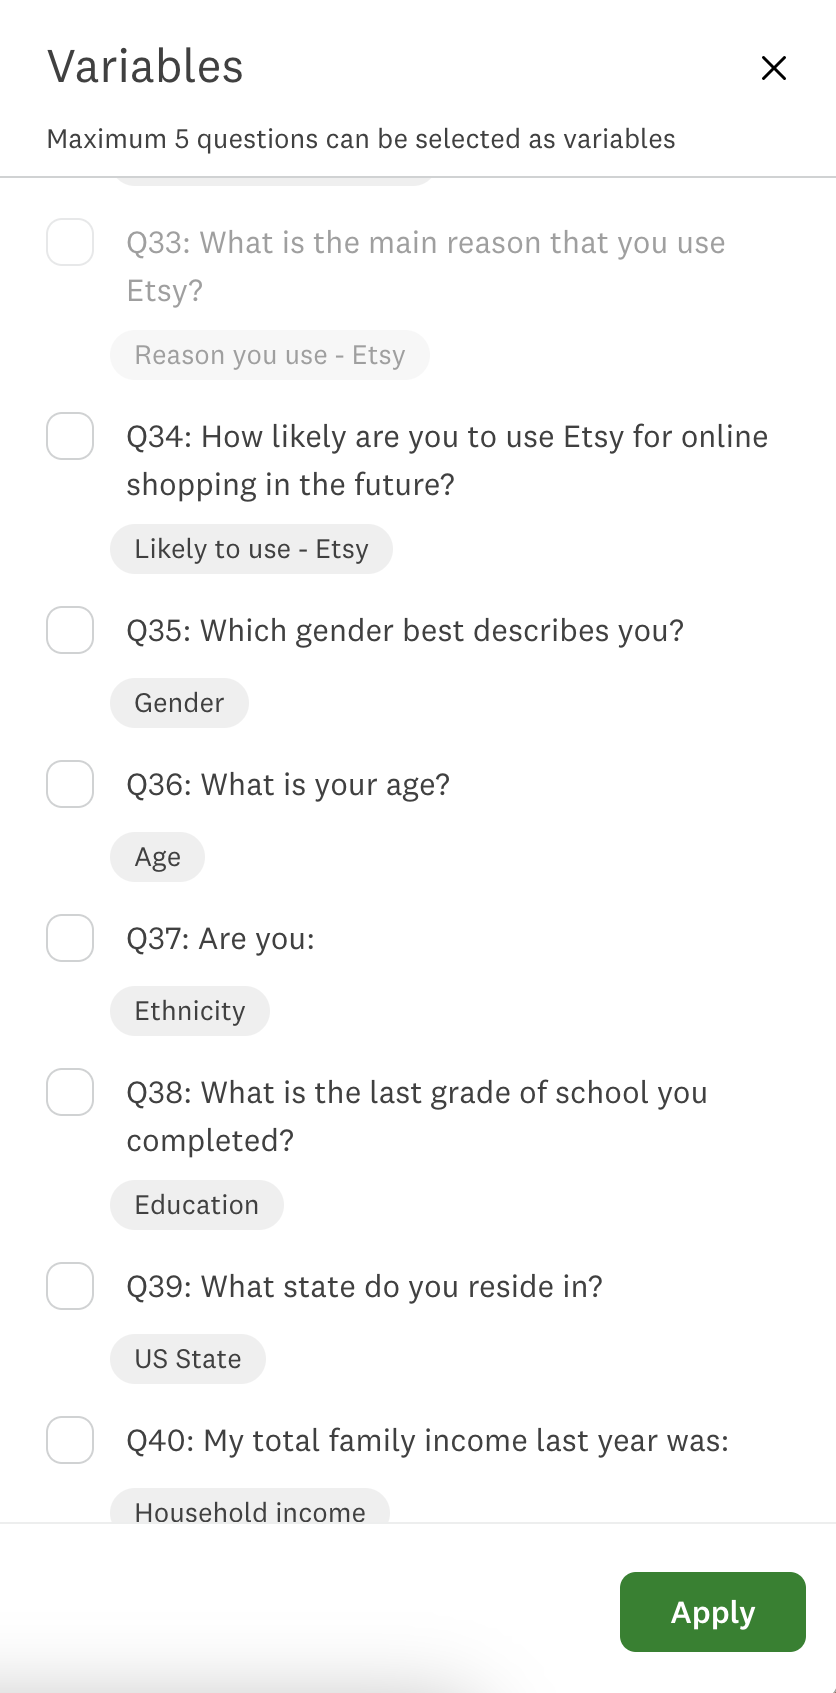
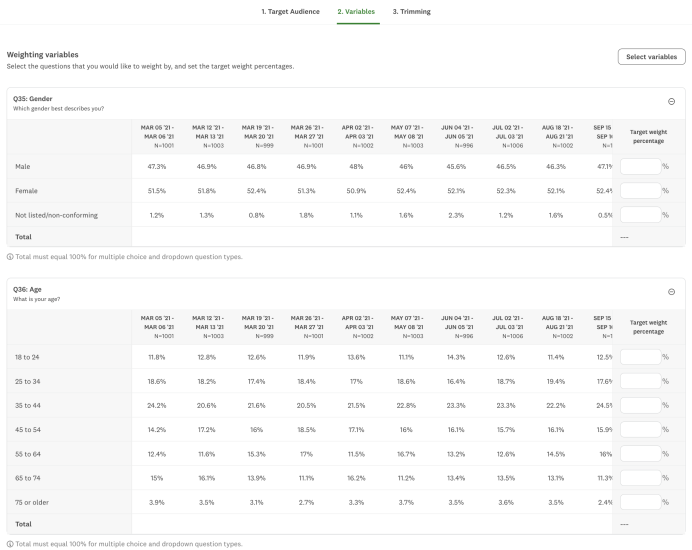
The first thing we’ll need to do – as seen below in the weighting feature on the SurveyMonkey platform – is choose which demographic questions should be used to re-weight survey respondents. In other words, which demographic questions do we think are likely to have skewed (overrepresented or underrepresented) response categories?
Here are three tips to help with this selection process:
- Think of demographic questions that might be highly related to or predictive of answers to the key questions you want to analyze. With our study, for example, age may be highly correlated with social media usage; younger adults are more likely to be familiar with newer social media platforms. Some social media sites might be more popular among certain gender groups. Finally, access to social media and the Internet more broadly might vary by region or location.
- Think of demographic variables in your particular sample or panel that were not targeted beforehand. For example, our US Gen Pop study did not target respondents based on age and we’ve already brainstormed, above, that age may be related to our key questions.
- Find demographic variables in your sample that appear or are confirmed to be skewed relative to your target population. We’ve already shown that, in our study, age is skewed relative to the US adult population. With some more digging, we might find other variables that are off.
It turns out that racial identity is another demographic variable that is skewed in our study:
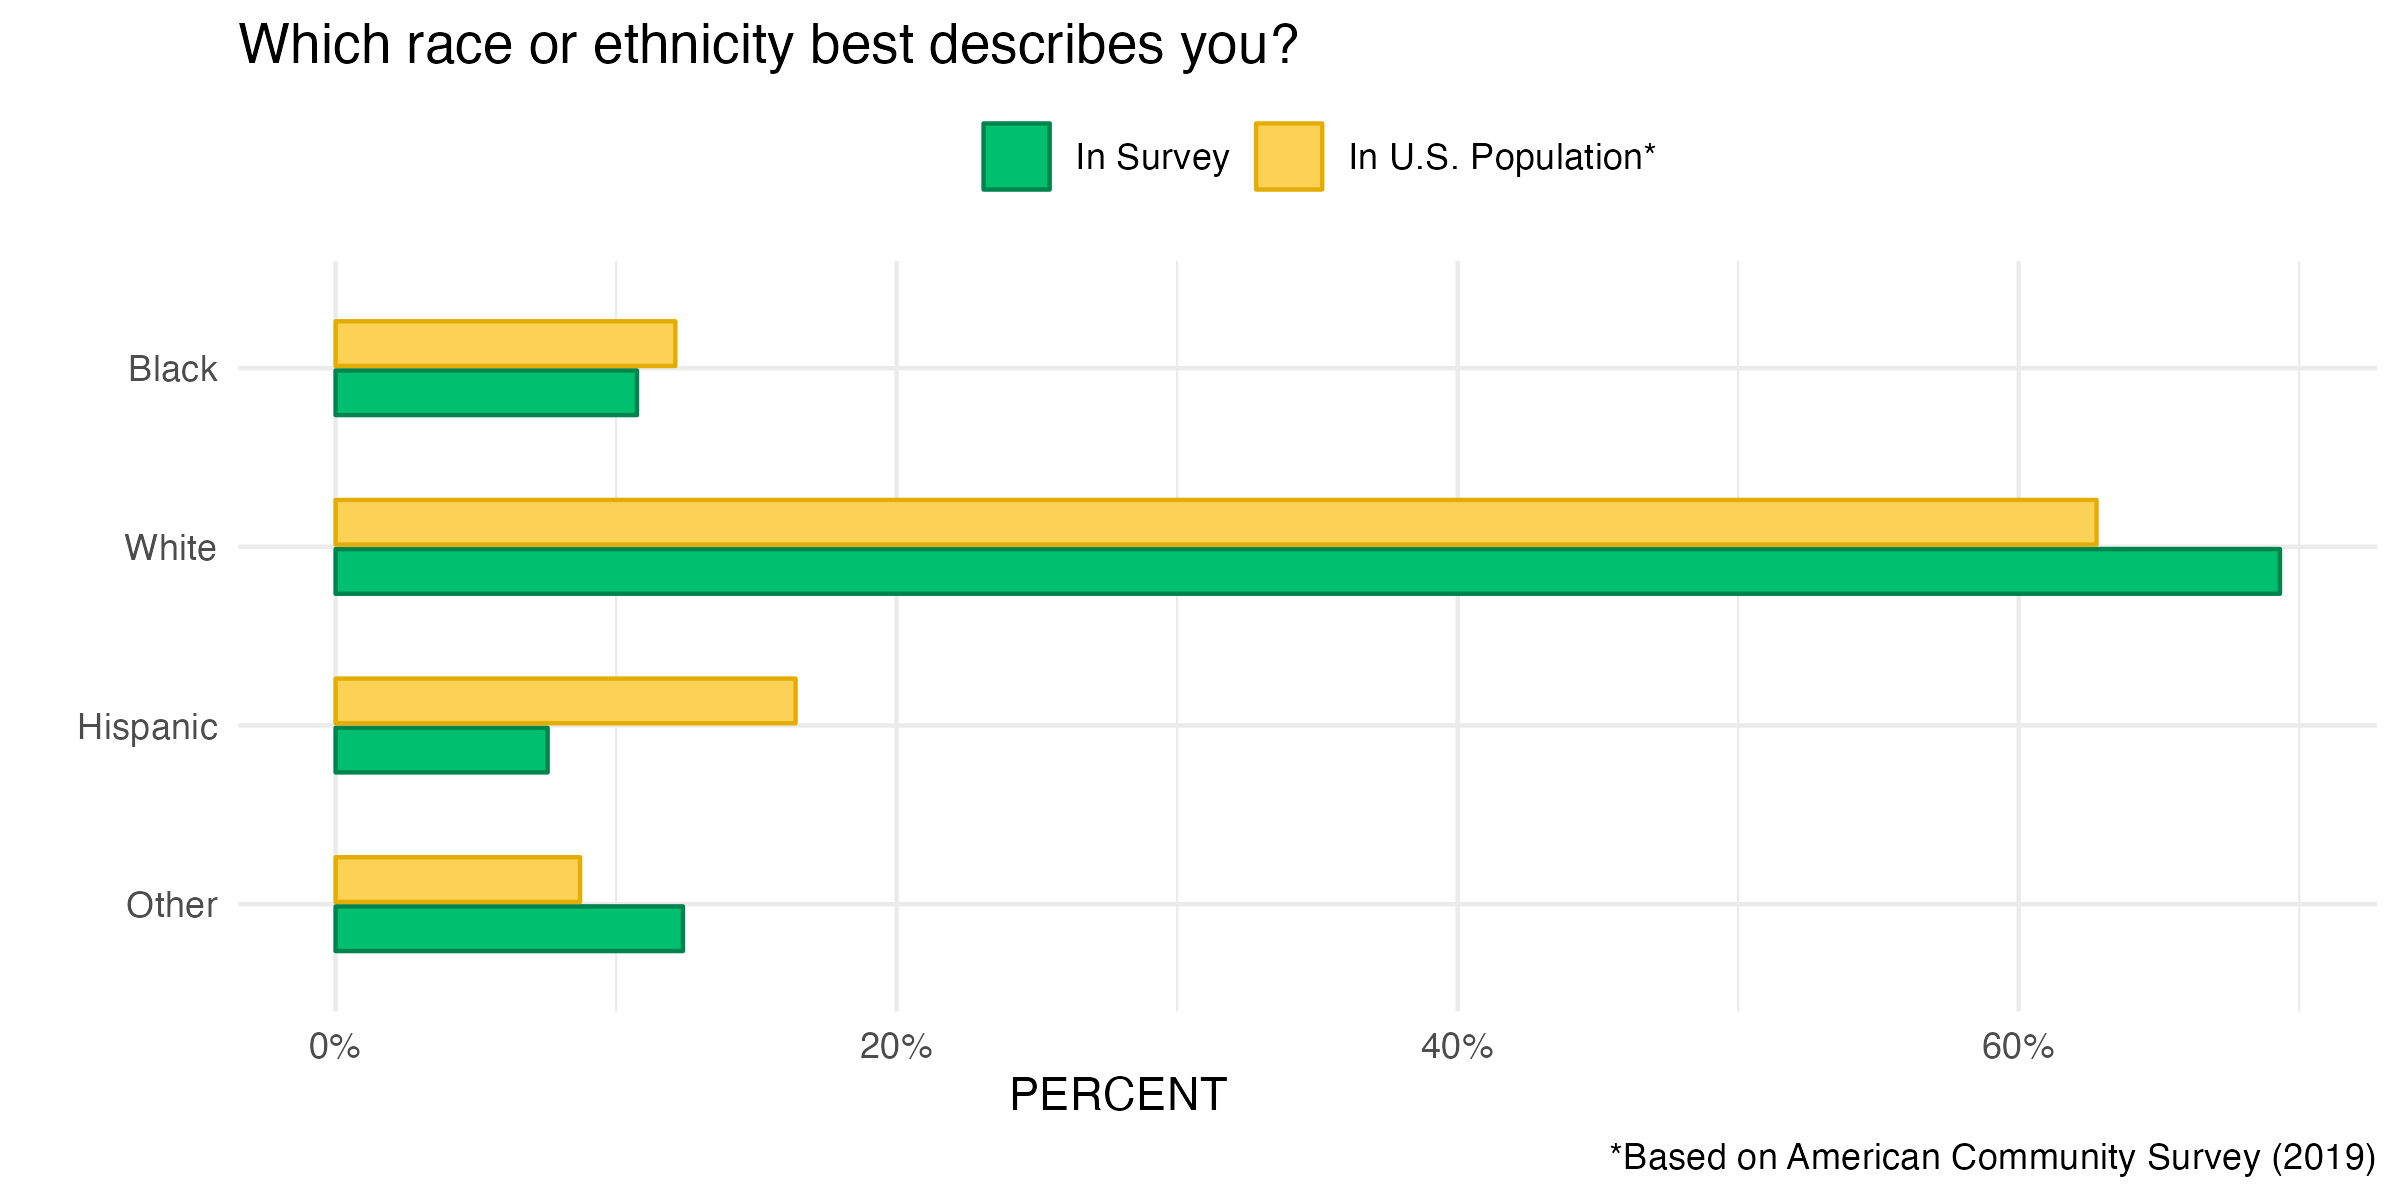
In particular white respondents in our survey are slightly overrepresented and Hispanics are seriously underrepresented. So we’ll add that question to our selection.
Note that in the SurveyMonkey weighting feature no more than 5 questions can be used to weight a survey. This is because weighting on many more variables can either be very computationally intensive, result in unstable or skewed weights (more on that below), or fail altogether. In general, it’s best to stick to 3-4 questions that clearly meet the above criteria.
As a rule of thumb, for U.S. Gen Pop studies, we’d recommend selecting from the following demographic variables (if they are asked for in your survey):
- Gender
- Age
- Race/ethnicity
- Education
- Region
For political polls or surveys in the US, we’d recommend additionally weighting on variables such as party affiliation and voter registration status.
2) Choose your population targets
After selecting the questions in our survey that map to variables we would like to weight, we need to specify our target weight percentages.In other words, what population we’re weighting to. Below is the form you’ll see on the SurveyMonkey platform at this stage in the weighting process.
A good reference for generating these target percentages for US Gen Pop studies is the US Census. In particular, the American Community Survey offers highly accurate breakdowns of many different demographic categories, including sex and education at varying levels of geography like national and by state. You can look up different tables corresponding to these breakdowns at data.census.gov.
Additionally, Wikipedia may be a convenient, although unofficial resource for looking up demographic information about certain countries (e.g. see this article for the United States) and for finding compiled statistics about specific subgroups that may not be available through the Census (e.g. the LGBTQ+ population or political affiliation breakdowns).
Finally, some careful Google searching can point you to high-quality polls, population registrars, and other sources that can provide demographic composition information. For example, when Googling “How many Democrats are there in the United States?,” one of the top results is a breakdown of party affiliation in the US population from a poll conducted by Gallup, a reputable political pollster.
To get you started, here are some population benchmarks of US adults, derived from the 2019 American Community Survey, that the SurveyMonkey Research Insights Team commonly uses as weighting targets.
| Demographic Group | % of US Adults (2019 ACS) |
| *Gender Male Female | 51.3% 48.7% |
| Age 18-24 25-34 35-44 45-54 55-64 | 11.9% 17.8% 16.5% 16.0% 16.6% |
| Education High school or less Some college College graduate Post graduate degree | 39.0% 30.4% 19.3% 11.4% |
| Race Asian Black Hispanic White Other | 5.8% 12.1% 16.4% 62.8% 2.86% |
*High quality estimates of other gender groups are unfortunately not available through the ACS.
After you’ve selected your target weight breakdowns—voilà! SurveyMonkey’s internal weighting algorithm will generate weights for each individual response so that the overall demographic composition closely resembles your specification.
3) Trim your weights
There’s one last recommended step before you can take a look at the resulting dataset: trimming your weights.

Why do this? Conceptually, trimming the generated weights—or setting a maximum and minimum threshold over which no weight should go above or below—makes sense because it ensures that no single respondent is either highlyover-weighted or under-weighted in your analysis, relative to all the others.
For example, we may trim our weights so that no respondent is weighted more than 10 times any other respondent; similarly, we’d like to prevent any respondent from being given a weight less than a tenth of any other respondent. In other words, no voice becomes too loud or too quiet!
Additionally, it is worth noting that weighting actually increases the margin of error for your survey. Trimming your weights ensures that the margin of error doesn’t unnecessarily grow.
4) Check the results
The first thing we’d check with our weighted survey is whether it solved the problem(s). That is, whether our survey respondents now look more like the US general population that we’re aiming for.
We can see that after applying our weights, the age and race distributions of our respondents do more closely approximate the US population than they did before.
What does our weighted (corrected) survey now tell us about social media familiarity? We can see from the chart below that 91% of US adults have heard of the most popular social media platform, Facebook, as compared to closer to 80% before weighting.
Many of the other social media sites are also much more well-recognized in this age- and race-corrected respondent pool than we previously realized.
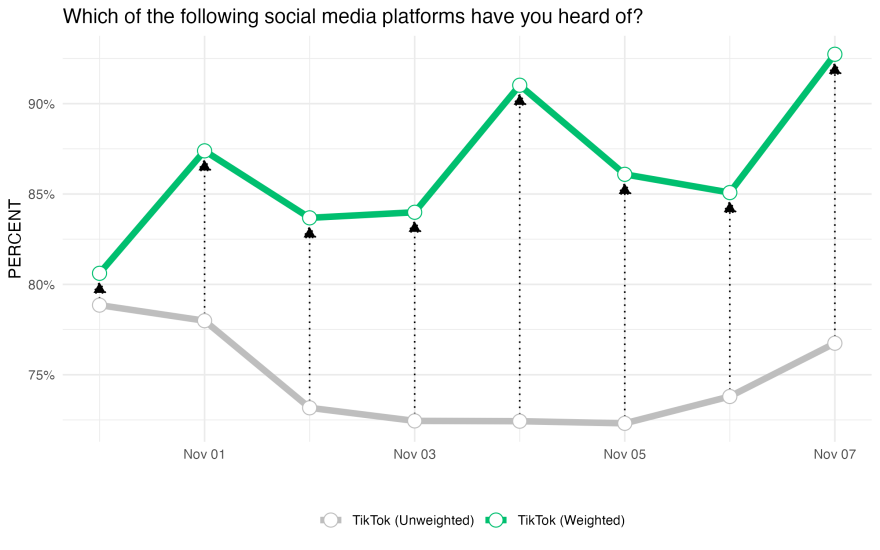
Remember that this study is technically a brand tracker. Zeroing in on just one brand, we can see below that weighting helps correct brand familiarity over time. Instead of a dip in brand familiarity, familiarity with TikTok has largely increased over the period of our study with some cyclical trends throughout the week according to the weighted survey.
Advanced weighting
Depending on your particular use case, you may require slightly more advanced customization in your weighting that is currently not supported in the SurveyMonkey platform, including:
- Specifying target weights for combined variables (e.g. age + race)
- Weighting more than 5 questions
- Trimming weights using custom thresholds
- Re-using the same targets for multiple, possibly large-n surveys
- Analyzing your data using the R programming language
If this describes your needs, we would recommend that you look at the svmkR package, a library in the R programming language built by SurveyMonkey experts to automate key survey research tasks like weighting.
The wait is finally over ... happy weighting!